November 3, 2026
What “Real-Time Dashboards” Actually Requires
Seth Therrien
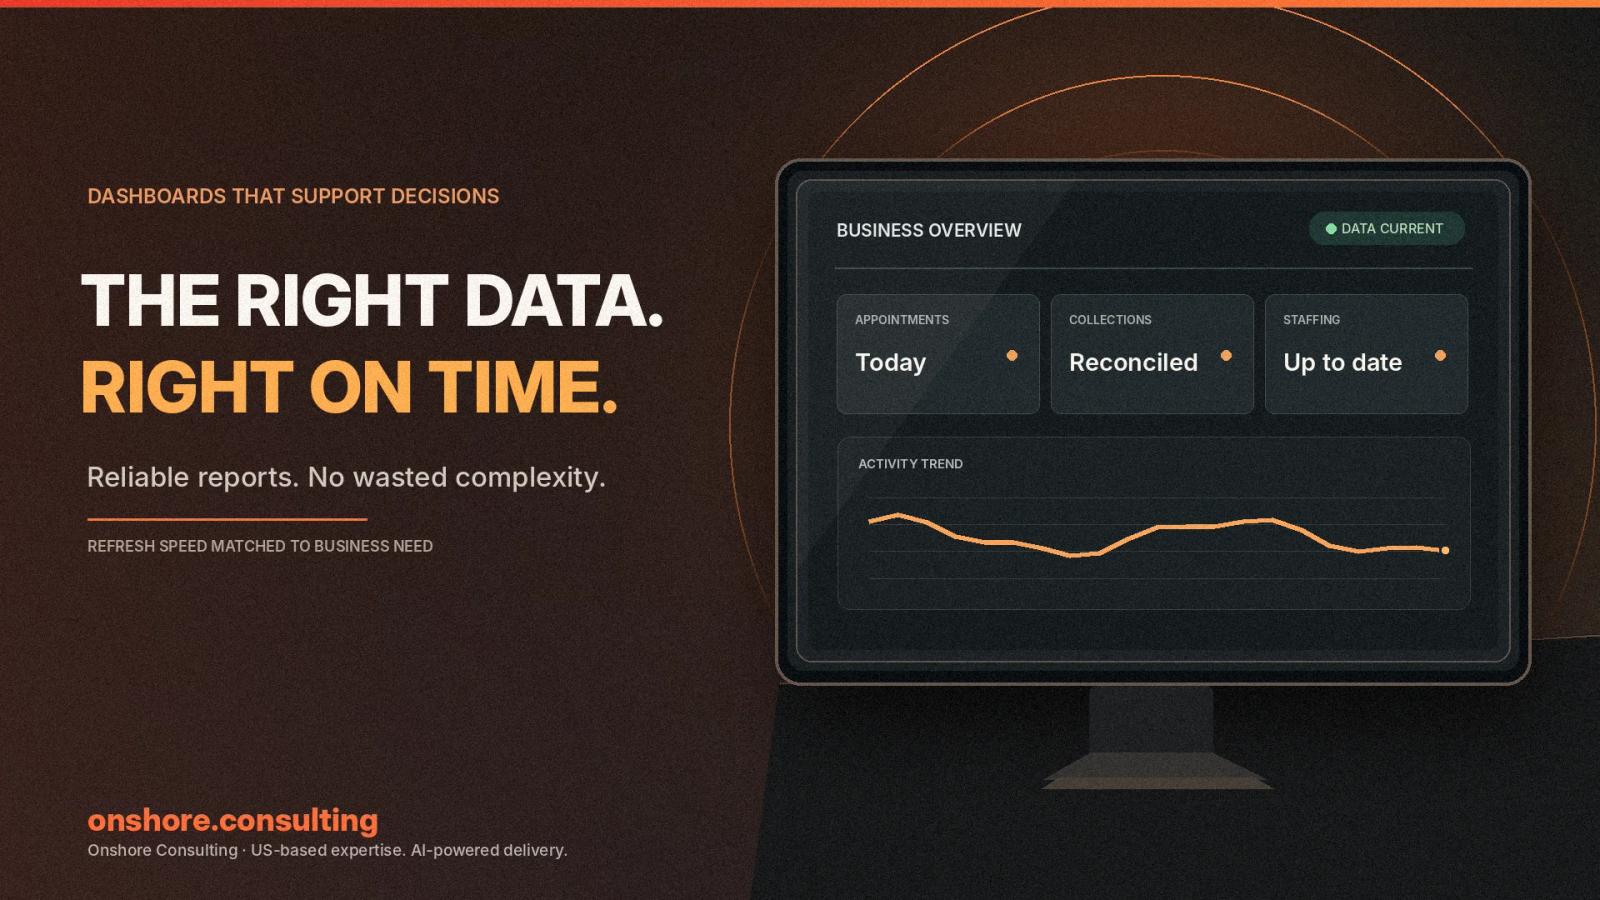
An executive asks for a real-time dashboard, and the technology discussion starts immediately. Someone suggests streaming software. Another person proposes replacing the reporting platform. Soon, the project costs more than the decision it was meant to support.
The missing question is simple: How quickly must someone act on the information? A trading system may need milliseconds. A clinic operator reviewing yesterday’s appointments may need a reliable morning report. A board reviewing quarterly performance may only require updated figures each week.
Those requirements are not variations of the same technical project. They call for different data movement, validation, staffing, and support. A beautiful dashboard cannot be more current than the systems feeding it. Faster screens do not fix late records or disputed definitions.
For most leadership reporting, fresh enough and dependable is more valuable than technically immediate. The useful goal is to match reporting speed to the business decision, then build only the infrastructure that the decision requires.
Real-Time Is A Business Requirement, Not A Feature
Real-time is often used as a label for several different expectations. The useful definition is the maximum acceptable age of the information when someone relies on it to make a decision.
The Five Practical Freshness Tiers
| Required Freshness | Typical Decision | Likely Data Approach | Relative Burden |
|---|---|---|---|
| Milliseconds to seconds | Automated trading or safety signals | Continuous event processing and rapid response | Very high |
| One to fifteen minutes | Fraud triage or operational exceptions | Event streaming or frequent incremental loads | High |
| Hourly | Staffing, service backlog, order visibility | Incremental or scheduled data pipelines | Moderate |
| Daily | Clinic performance and executive KPIs | Scheduled batch processing and validation | Lower |
| Weekly | Board review and strategic scorecards | Scheduled reporting with reconciliation | Usually lowest |
These are planning categories, not guaranteed delivery times. Source-system limits, data volumes, and reliability requirements can change the right technical approach. A five-minute promise also needs a measurable end-to-end definition.
Start With The Decision, Then Choose The Clock
The right refresh interval comes from the action a team must take. Asking what information changes, who responds, and when action becomes too late prevents unnecessary technical commitments before the project starts.
1. Name the decision. Is someone changing staffing, approving a transaction, or reviewing monthly revenue?
2. Identify the response window. Determine when new information stops being useful for that action.
3. Check how often the source changes. A daily export cannot support a reliable five-minute target.
4. Set the acceptable delay. Specify a maximum age and the proportion of updates that must meet it.
5. Price the consequence of waiting. Compare delayed decisions with implementation and operating costs.
Consider a clinic group checking cancellations, provider utilization, and daily collections. Supervisors may need a fifteen-minute view of today’s cancellations. Financial leadership may need yesterday’s reconciled collections. Those are separate refresh requirements, even when both appear on one screen.
This decision-first approach also reduces shelfware. The related article why dashboards fail, explains why useful reporting starts with actual business workflows rather than available charts.
Your Data Must Arrive Before The Dashboard Can Refresh
A dashboard is the final display, not the complete reporting system. Information travels through several steps before a business leader sees it, and the slowest necessary step sets the practical freshness limit.
- Source capture: The original application must record the event or transaction correctly.
- Data movement: An integration transfers the new record into a reporting environment.
- Validation: Checks identify missing records, duplicates, and unexpected values before publication.
- Metric preparation: Business rules calculate trusted measures from the incoming records.
- Display refresh: The reporting tool retrieves and presents the newest approved information.
A dashboard might refresh every minute while its source updates only once daily. That is a fast screen showing old information. Similarly, late invoices can change previously reported revenue even after a successful refresh.
Show Freshness And Failure Clearly
A trustworthy dashboard needs more than a clock in the corner. It should show the newest available source record, the last successful processing time, and whether an expected update failed.
Critical metrics also need agreed meanings and an accountable data owner. Before expanding reports, our guide, before your first data engineer starts explains how source inventories, tested data models, and approved definitions support reliable reporting.
The Infrastructure Changes With The Refresh Requirement
Faster updates add engineering decisions that ordinary reporting can often avoid. The cost difference comes from continuous processing, source integrations, recovery procedures, and operating support, not simply from purchasing a faster dashboard tool.
Scheduled Batch Processing
A scheduled pipeline collects data at predictable intervals and prepares it for reporting. Daily or hourly loads can be efficient when decisions happen on a similar schedule. They are also easier to reconcile after a failure.
This approach still requires monitoring, access controls, and agreed definitions. It does not require a permanently active stream for every table. Many executive scorecards can start here.
Frequent Incremental Processing
For a fifteen-minute or hourly goal, systems may transfer only new or changed records. That reduces repeated work but requires careful handling of duplicates, late arrivals, and overlapping updates.
The reporting license can impose its own limits. For example, Microsoft’s scheduled refresh guidance documents different daily refresh allowances across Power BI license and capacity tiers. A fifteen-minute target should be checked against the actual deployment.
Continuous Event Streaming
Sub-second processing requires a different level of coordination. Systems must capture events continuously, process them with low delay, and provide reliable actions when the service or network fails.
Streaming also introduces more operating responsibilities, including alerting, replay, security, and around-the-clock incident response. Those costs can be justified when a delayed decision creates immediate financial or safety exposure.
Why One Scope Might Be Far More Expensive
Consider two hypothetical project scopes. They illustrate why “real-time” is an incomplete requirement, not what an actual implementation will cost. Budget figures must come from system discovery and a defined scope.
| Illustrative Budget | Example Scope | Cost Drivers |
|---|---|---|
| $10K example | Focused dashboard using accessible, already reliable data. | Limited integrations, scheduled refreshes, basic validation, and a small reporting audience. |
| $200K example | Business-critical streaming program across several difficult systems. | Event ingestion, recovery, security review, monitoring, incident support, and higher reliability testing. |
Neither figure is a quote, a typical market price, or a promise. A difficult batch integration can cost more than a simple streaming feed. The comparison is about scope and ongoing obligations.
The “Fresh Enough” Dashboard Can Be The Better Investment
The phrase “90% of the value at 10% of the cost” captures a useful tradeoff. It is not a measured ratio that applies to every business or every dashboard investment.
For an executive managing regional clinics, a reconciled daily report may answer almost every recurring question. Adding continuous updates might improve the timestamp without improving a single decision. Faster data has little value when nobody acts faster.
A practical design gives different metrics different update schedules. Staffing exceptions might need fifteen-minute updates, collections might need daily reconciliation, and strategic trends might only require weekly review.
Teams can preserve usefulness and control expense through three habits:
- Publish the last successful refresh time so users know what they are seeing.
- Escalate time-sensitive exceptions separately instead of rebuilding the whole dashboard around them.
- Measure decisions and adoption before expanding processing speed or data coverage.
The objective is not to minimize refresh frequency at any cost. It is to pay for speed only where quicker information changes an operational or financial outcome.
When Genuine Real-Time Processing Is Necessary
Some decisions lose value almost immediately, and delayed data can cause direct harm. In those cases, a continuously updated system may be essential, but the response mechanism matters more than the dashboard itself.
- Fraud detection: Suspicious activity may need automated scoring before a transaction is approved.
- Safety monitoring: Equipment or environmental signals may need immediate alerts and clear response ownership.
- Automated trading: Price and order information may require very low latency and controlled execution.
These are not ordinary executive reporting tasks. They often need event-driven alerts, automated controls, tested failover, and designated responders. A dashboard can help investigate incidents afterward, but should not be the only safety mechanism.
For high-stakes systems, test the full chain from source event to intervention. A fast chart is insufficient if the alert arrives late or nobody owns the response.
A Practical Decision Rule For Your Next Dashboard
Before approving a reporting project, document a small set of requirements the business can verify. The document should connect each refresh target to an owner, a decision, and a measurable benefit.
1. List the recurring decisions the dashboard must support, including their users and deadlines.
2. Set a maximum data age for each metric instead of requesting “real-time” everywhere.
3. Audit the actual data path from source applications through validation and reporting tools.
4. Pilot one reporting workflow using the least complex approach that meets the requirement.
5. Track business outcomes such as response time, reporting errors, and consistent usage.
If a daily pilot supports the decision, keep it daily. If users miss important events between refreshes, increase frequency only for the affected signals. That evidence provides a defensible basis for further investment.
Conclusion
Real-time dashboards are not a single product category. They represent different business deadlines, each with different technical and financial consequences.
The right starting point is the decision, not the dashboard specification. Determine when information becomes too old to help.
Then inspect the full data path, choose an appropriate refresh method, and make failures visible to the people relying on it.
Pay for continuous speed when the business truly needs it. Otherwise, dependable and fresh-enough reporting is often the smarter investment.